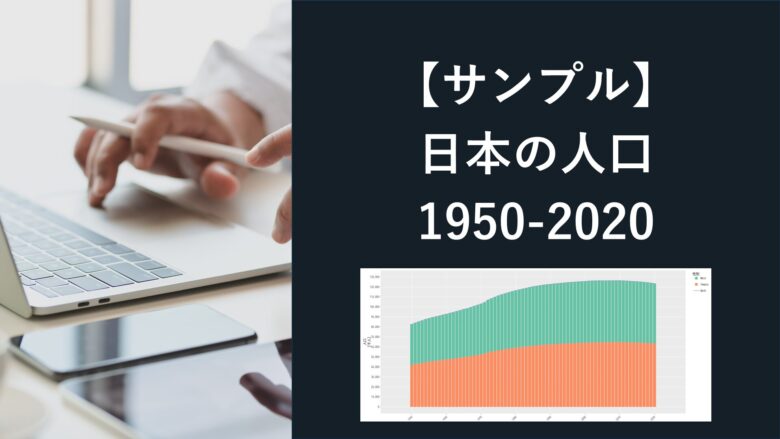
使用した加工データ
コード
# Rの分析の準備 (Google Colaboratory)
# パッケージがないよ、とエラーが出る場合は必要なパッケージをインストールする
%%R
.libPaths("library")   # libraryの保存先フォルダ指定
library(tidyverse)   # ggplot2やdplyr、readr、tibble、magrittrなどRの基本パッケージ群
library(readxl)
library(extrafont)   # フォントの設定
library(systemfonts)
library(openxlsx)   # エクセル、シート名読み込み
library(DT)   # インタラクティブな集計表
library(gt)   # 綺麗なクロス集計表出力
library(gtsummary)   # 綺麗なサマリークロス集計表出力
library(RCurl)   # HTTPリクエストを作成
library(plotly)   # インタラクティブなグラフ作成
library(RColorBrewer) # カラーパレット
library(scales)
# csvファイルを作業ディレクトリに置いた場合
%%R
df <- read_csv("df_japanese_population.csv", skip = 0, col_names=T)# X軸をYear、Y軸をGenderとして縦型のロングデータに変換
# Genderは、Both、Male、Femaleのカテゴリ変数とする
# keyをカテゴリ変数のGenderとし、valueの人数はPopulationとする
%%R
df_long <- df %>% # df_longのデータテーブルを新規作成、dfのデータに対し、パイプ(%>%)で次の処理につなげる
gather(key = Gender, value = Population, -Year) # -YearでYaerを除くカラムをカテゴリ変数Genderとし、人口データをPopulationとする
df_long# カラーパレットの指定
%%R
display.brewer.all() # カラーパレット一覧
colors <- brewer.pal(8, "Set2") # Set2 8色すべて読み込み
scales::show_col(colors) # colorsに入れた色の一覧を表示(左上から右に1,2,3,・・・)%%R -w 800 -h 480 -u px
colors <- brewer.pal(8, "Set2")
family_sans <- "BIZ UDGothic"
family_serif <- "BIZ UDMincho"
# BothのPopulationデータを抽出
df_both <- df_long %>%
filter(Gender == "Both")
# 文字テーマの定義
theme_set(theme_minimal() +
theme(
# plainをboldにすると凡例カテゴリ文字を太字、italicも可
text = element_text(family = family_sans, face = "plain", size = 12), # 凡例カテゴリ
title = element_text(face = "plain"), # タイトルと凡例タイトル
axis.title = element_text(face = "plain"), # XY軸の文字
)
)
# ggplotでグラフ作成
p <- df_long %>%
mutate(Gender = factor(Gender, levels=c("Male","Female","Both"))) %>% # mutateでGenderのfactor型の順番を書き換え
filter(Gender != "Both") %>%
ggplot(aes(x = Year, y = Population, fill = Gender)) + # ggplotのコード連結は"+"を使う
geom_bar(stat="identity") +
geom_line(data = df_both, aes(x = Year, y = Population, group = 1), color = colors[3]) + # Bothの折れ線グラフを追加
scale_fill_manual(values = colors) + # カラーパレットをcolorsに指定
scale_x_continuous(breaks=seq(1950, 2020, by=10),limits=c(1945, 2025)) +
scale_y_continuous(breaks=seq(0,130000,by=10000),limits=c(0,130000), labels = comma) +
theme(axis.text.x = element_text(angle = 45, hjust = 1)) + # X軸の西暦の数字スケールを斜め45度に
labs(title = "日本の人口 [千人]", x = "[年]", y = "人口\n[千人]", fill = "性別")
p%%R
ggplotly(p) %>% # ggplotで作成したグラフ"p"をplotlyのグラフに変換
saveWidget("p.html") # HTMLファイルで保存PORT = 8000
PATH = '/p.html'
#サーバー立ち上げ
!nohup python3 -m http.server $PORT > server.log 2>&1 &
from google.colab import output
output.serve_kernel_port_as_window(PORT, path=PATH)日本語表示が文字化け(豆腐化)する場合は、過去の記事を参考にしてください。
出典および加工について
表示しているコンテンツは、政府統計(e-stat)のデータを基にして加工しています。
ただし、国によって内容を保証するものではありません。
出典:政府統計の総合窓口 (e-stat.go.jp) 人口推計ー長期時系列データ

